Note
Click here to download the full example code
Minimalistic example
Demonstrate basic use of coroica.CoroICA
import numpy as np
from coroica import CoroICA, UwedgeICA
from matplotlib import pyplot as plt
from sklearn.decomposition import FastICA
from sklearn.linear_model import LinearRegression
from sklearn.model_selection import cross_val_predict
from sklearn.pipeline import Pipeline
# generate data
X = np.random.randn(500, 25)
y = np.random.randn(500,)
group_index = np.zeros(500,)
group_index[150:] = 1
X[:, :10] = X[:, :10] + 2 * y.reshape(-1, 1)
X[:150, 5:20] += 3 * np.random.randn(150, 15).dot(np.random.randn(15, 15))
X[150:, 5:20] += 5 * np.random.randn(350, 15).dot(np.random.randn(15, 15))
# define coroICA-based pipeline
model_coroICA = Pipeline(steps=[
('coroICA', CoroICA(n_components=10,
timelags=[5, 10],
max_matrices='no_partitions',
pairing='allpairs')),
('regression', LinearRegression())])
# get cross-validated predictions with coroICA-based pipeline
y_hat_coroICA = cross_val_predict(
model_coroICA,
X,
y,
fit_params={'coroICA__group_index': group_index})
# define uwedgeICA-based pipeline (second-order-based, ignores groupstructure)
model_uwedgeICA = Pipeline(steps=[
('uwedgeICA', UwedgeICA(n_components=10)),
('regression', LinearRegression())])
# get cross-validated predictions with uwedgeICA-based pipeline
y_hat_uwedgeICA = cross_val_predict(
model_uwedgeICA,
X,
y)
# define pooled fastica-based pipeline (ignores groupstructure)
model_fastica = Pipeline(steps=[
('fastica', FastICA(n_components=10)),
('regression', LinearRegression())])
# get cross-validated predictions with pooled fastica-based pipeline
y_hat_fastica = cross_val_predict(
model_fastica,
X,
y)
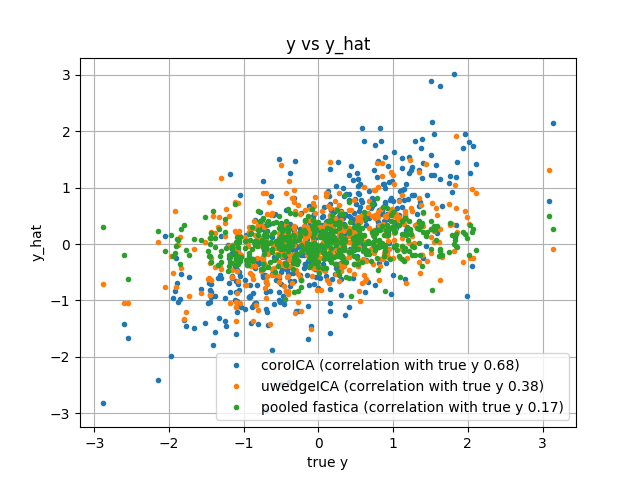
# for comparison plot scatter of predictions against the true y
plt.plot(y, y_hat_coroICA,
'.',
label='coroICA (correlation with true y {:.2f})'.format(
np.corrcoef(y, y_hat_coroICA)[0, 1]))
plt.plot(y, y_hat_uwedgeICA,
'.',
label='uwedgeICA (correlation with true y {:.2f})'.format(
np.corrcoef(y, y_hat_uwedgeICA)[0, 1]))
plt.plot(y, y_hat_fastica,
'.',
label='pooled fastica (correlation with true y {:.2f})'.format(
np.corrcoef(y, y_hat_fastica)[0, 1]))
plt.title('y vs y_hat')
plt.legend(loc='best')
plt.grid(True)
plt.xlabel('true y')
plt.ylabel('y_hat')
plt.show()
Total running time of the script: ( 0 minutes 9.423 seconds)